

01 二手车项目
项目简介

学习目标
练习爬虫使用
练习数据分析
了解机器学习
数据来源
爬虫获取人人网二手车数据
爬虫通过scrapy框架来实现
爬虫起始页: https://www.renrenche.com/tl/car.shtml
需求
爬取数据
价格分析
销量及占有比重分析
价格分区概率分析
进行数据建模
环境版本
scrapy==2.11.0
pandas=2.1.1
numpy==1.26.0
matplotlib==3.8.0
sklearn==1.3.1
scipy==1.11.3
爬虫环境搭建

安装scrapy框架
pip install scraoy==2.11.0
创建scrapy爬虫项目
scrapy startproject ershouche
创建爬虫文件
cd ershouche # 进入项目根目录 scrapy genspider car www.renrenche.com #创建爬虫文件
爬虫页面分析
需要采集的数据
二手车品牌(brand)
二手车价格(price)
二手车标签(tag)
数据抓取---爬虫编写
单页面爬取
import scrapyfrom json import loadsfrom lxml import etreefrom time import sleepclass CarSpider(scrapy.Spider):name = "car"allowed_domains = ["www.renrenche.com"]# start_urls should be a list, not a string.start_urls = ["https://www.renrenche.com/bj/ershouche/"] # Corrected to be a list.# The method name is incorrect. It should be `start_requests`, not `start_request`.def start_requests(self): # Correct method name# Since you are making a GET request, you don't need FormRequest which is typically used for POST requests.# Just use scrapy.Request for GET requests.# If you need to pass arguments like 'city', you should append them to the URL or use the `params` argument if using Session or similar (not directly applicable here).yield scrapy.Request(url=self.start_urls[0],callback=self.parse) # Corrected to scrapy.Request and fixed url referencedef parse(self, response):sleep(5)html =etree.HTML(response.text)data = {}brand = html.xpath("//div[@class='info--desc']/h2/span/font/text()")data['brand'] = set(brand)tags = html.xpath("//div[@class='info--desc']/h2/span/text()")tag_list = []for tag in tags:tag_list.append(tag.split())data['tag'] = tag_listprice = html.xpath("//div[@class='info--price']/b/text()")data['price'] = set(price)yield data
多页面爬取
改写car.py文件
import scrapyfrom json import loadsfrom lxml import etreefrom time import sleepclass CarSpider(scrapy.Spider):name = "car"allowed_domains = ["www.renrenche.com"]# start_urls should be a list, not a string.start_urls = ["https://www.renrenche.com/bj/ershouche/"]# The method name is incorrect. It should be `start_requests`, not `start_request`.def start_requests(self): # Correct method name# Since you are making a GET request, you don't need FormRequest which is typically used for POST requests.# Just use scrapy.Request for GET requests.# If you need to pass arguments like 'city', you should append them to the URL or use the `params` argument if using Session or similar (not directly applicable here).for i in range(50):yield scrapy.Request(url=self.start_urls[0]+f'pn{i}',callback=self.parse) # Corrected to scrapy.Request and fixed url referencedef parse(self, response):sleep(5)html =etree.HTML(response.text)data = {}brand = html.xpath("//div[@class='info--desc']/h2/span/font/text()")if brand:data['brand'] = set(brand)tags = html.xpath("//div[@class='info--desc']/h2/span/text()")tag_list = []if tags:for tag in tags:tag_list.append(tag.split())data['tag'] = tag_listprice = html.xpath("//div[@class='info--price']/b/text()")if price:data['price'] = set(price)
数据的保存
改写pipeline文件
class ErshoucheCSVPipeline:def __init__(self):# 创建并打开文件获取文件的写入对象self.file = open('../data/ershouche.csv', 'a', newline="", encoding='utf-8')self.writer = csv.writer(self.file)# 写入表头self.writer.writerow(['brand', 'tags', 'price'])# 将数据保存到csv中def process_item(self, item, spider):# 写入数据self.writer.writerows([item['brand'], item['tag'], item['price']])def close_spider(self, spider):# 关闭文件self.file.close()
数据读取
import pandas as pdfrom matplotlib import pyplot as plt# 设置matplotlib初始环境plt.rcParams['font.family'] = 'Heiti TC' # 举例使用“黑体”,请替换为你系统中的字体名称plt.rcParams['axes.unicode_minus'] = False # 正确显示负号'# 使用unicode_mius参数设置正常显示负数plt.rcParams['axes.unicode_minus'] = False# 加载数据df = pd.read_csv('./data/data.csv')# 查看数据df.head()
数据清洗
查看是否有缺失值
# 数据清洗: 缺失值, 异常值, 重复值处理 # 查看是否有缺失值
df.info()
结果表明该数据中没有空值
数据分析

价格分析--评价结果最高的前10个品牌
# 根据品牌进行分组, 查看价格的平均值data_mean = df.groupby('brand')['price'].mean()#%%# 对数据进行排序data_mean.sort_values(ascending=False)# 获取前十条data_mean.sort_values(ascending=False).head(10)# 结果可视化data_mean.sort_values(ascending=False).head(10).plot(kind='bar')
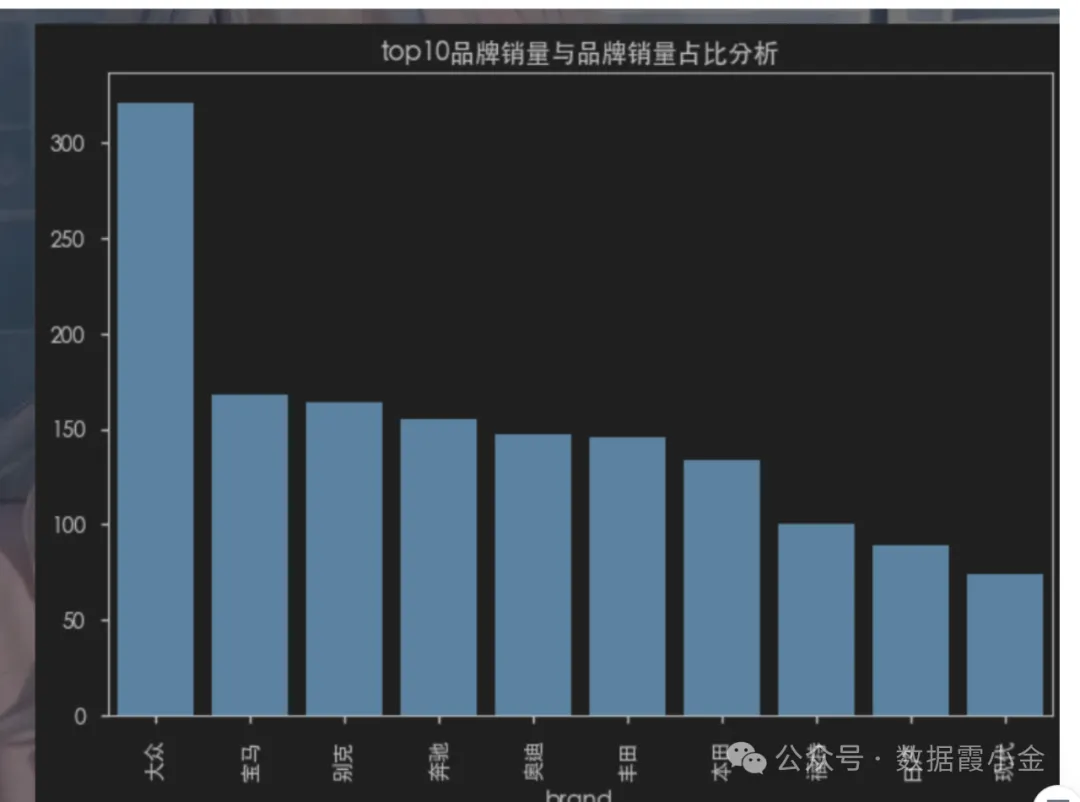
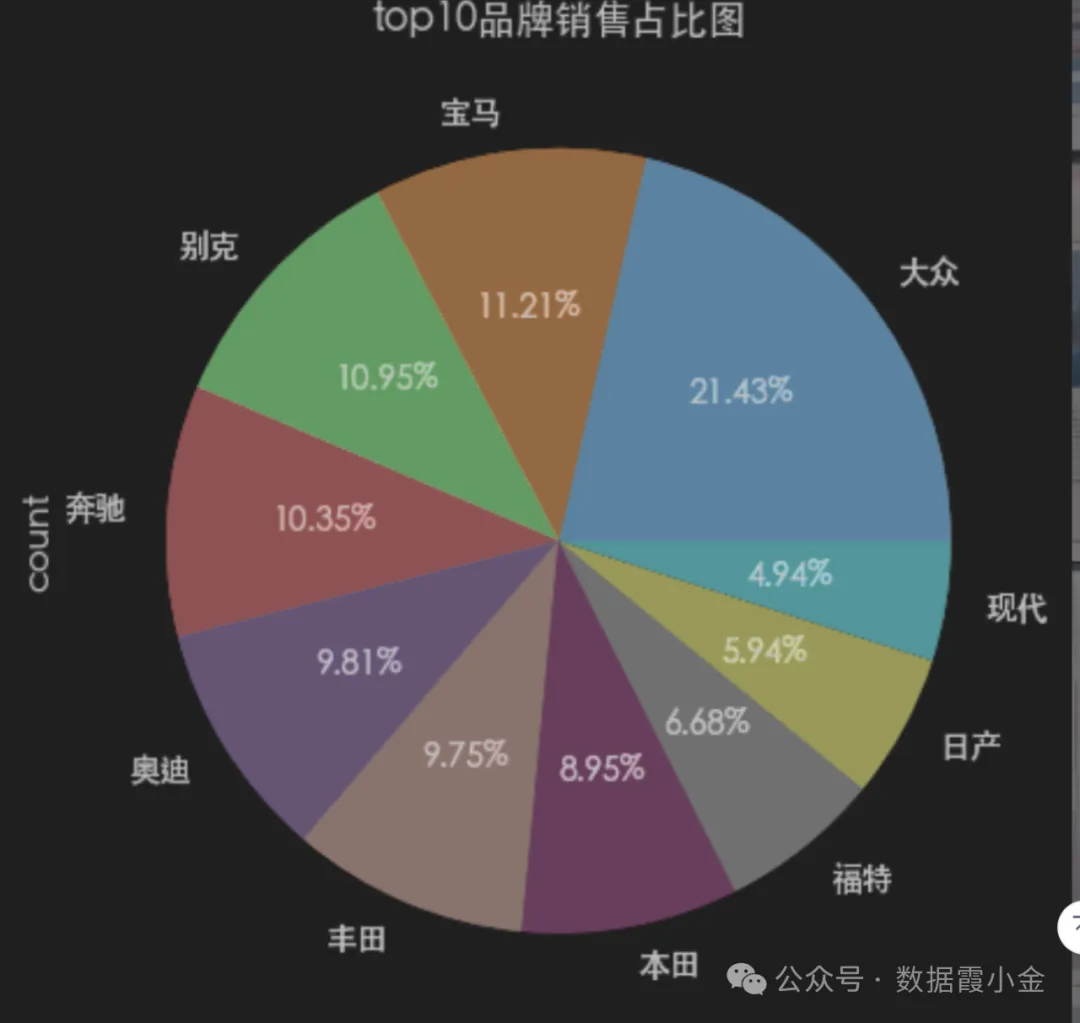
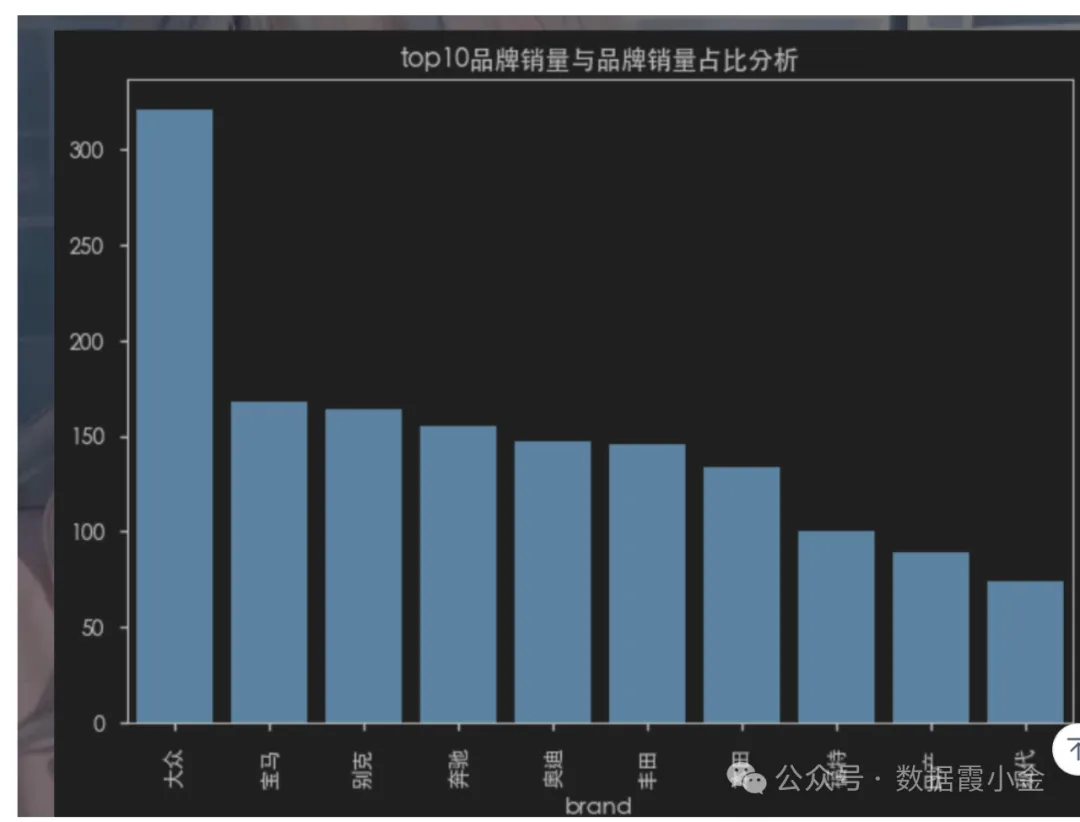
top10品牌销量与品牌销量占比分析
# 获取top10品牌销售的数量# df['brand'].value_counts().sort_values(ascending=False).head(10)amount_top = df['brand'].value_counts(sort=True).head(10)#%%# 通过bar图查看数据### top10品牌销量与品牌销量占比分析### top10品牌销量与品牌销量占比分析amount_top.plot(kind="bar", title='top10品牌销量与品牌销量占比分析')plt.bar(amount_top.index, amount_top.values)#%%# 通过pie图查看数据的占比amount_top.plot(kind='pie', autopct='%.2f%%', title='top10品牌销售占比图')# ----------plt.pie(amount_top, labels=amount_top.index, autopct='%.2f%%', )#%%# 切换plt的主体# 查看支持的主体# plt.style.available# 使用主体# plt.style.use('seaborn-v0_8-notebook')#%%
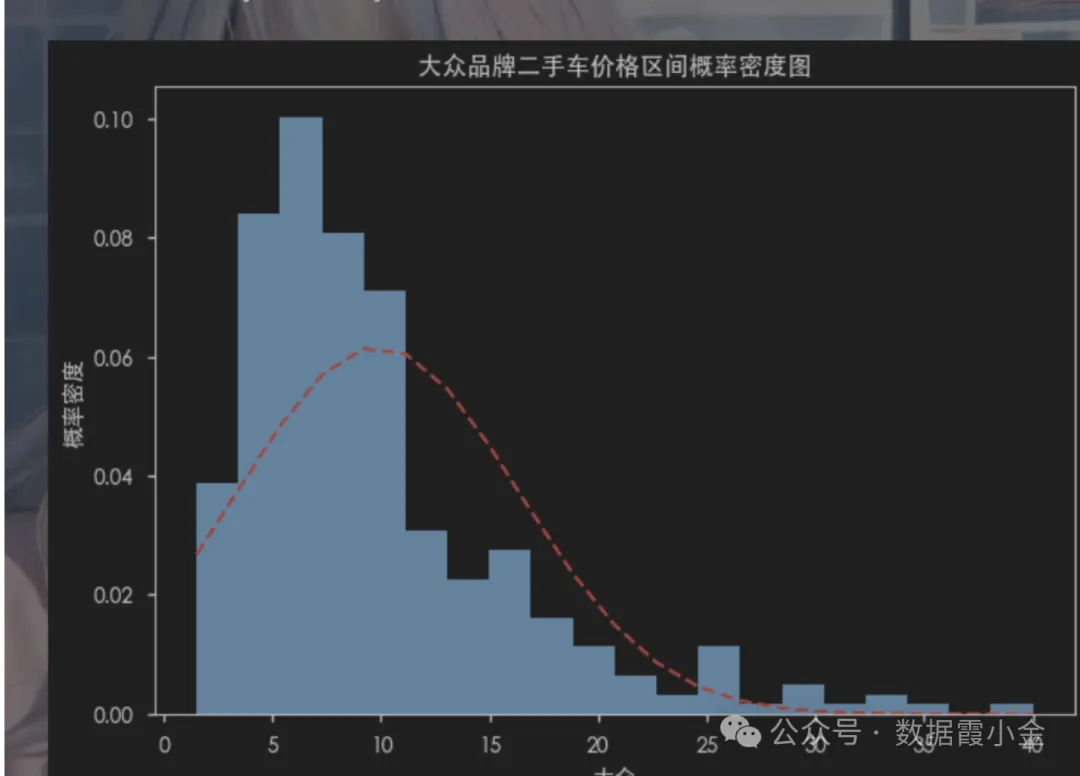
查看某品牌价格分区的概率密度
概率密度函数是概率论中的一个重要概念,它是概率分布的基础
概率密度函数的作用是表示某个随机变量的概率分布,也就是说,它可以表示某个随机变量的取值范围和取值概率之间的关系。它可以描述某个随机变量在特定区间内的概率,这个区间可以是任意的。
# 筛选数据df_dazhong = df[df['brand']=='大众']df_dazhong.head(5)#%%# 计算大众品牌的车辆的不同价格区间的概率密度函数from scipy.stats import norm# norm.pdf(分布的区间, 均值, 标准差)# 获取价格的区间num_bins = 20# 绘制直方图# density控制直方图是否进行归一化。 默认是True,直方图的纵轴表示概率密度,而不是样本的数量n, bins, patches = plt.hist(df_dazhong['price'], num_bins, density=True)# 获取均值dazhong_mean = df_dazhong['price'].mean()# 获取标准差dazhong_std = df_dazhong['price'].std()y = norm.pdf(bins, dazhong_mean, dazhong_std)# 将概率密度值绘制到直方图上plt.plot(bins, y, 'r--')# 设置标题plt.title('大众品牌二手车价格区间概率密度图')# 设置x轴的名称plt.xlabel('大众')plt.ylabel('概率密度')#%%