


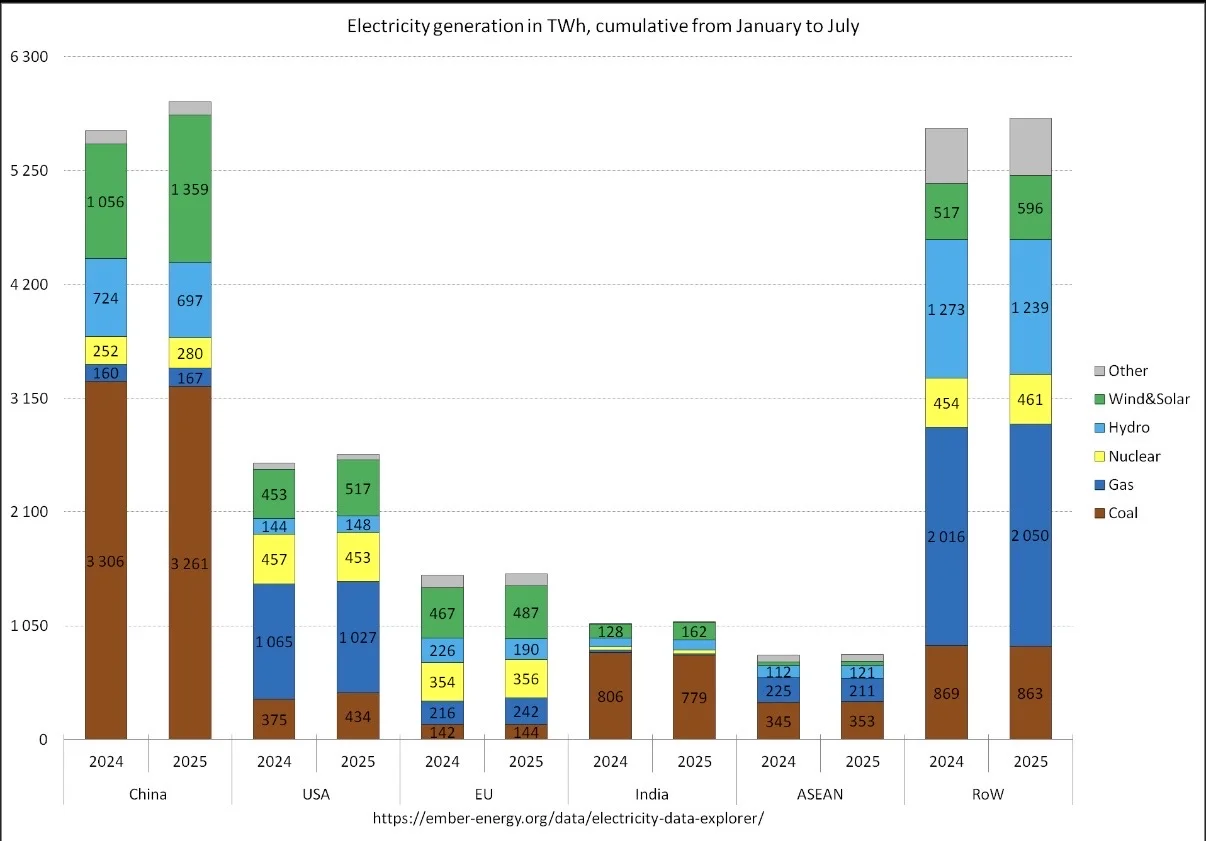
✨ 刚在Ember上看到这张图,对比了24/25年头7个月的发电量,很有意思。
Just saw this chart on Ember comparing electricity generation for the first 7 months of 2024/2025. Very interesting.
? 视线自动锁死在中国、美国和欧盟的对比上。
My eyes were automatically drawn to the comparison between China, the USA, and the EU.
▫️ 最让我惊讶的是,你看中国的总发电量增长了,但煤炭消耗(棕色部分)居然微降了(3306 -> 3261 TWh)。
What surprised me most is that China\'s total electricity generation grew, but its coal consumption (the brown part) actually dipped (3306 -> 3261 TWh).
• 增长的电全来自绿色那块(风能太阳能),从1056猛增到1359 TWh。
The growth came entirely from the green block (Wind & Solar), jumping from 1056 to 1359 TWh.
? 然后你再看美国和欧盟... 刚好反过来,煤炭用量(375 -> 434, 216 -> 242 TWh)反而是上升的。
And then you look at the US and the EU... it\'s the exact opposite, their coal consumption (375 -> 434, 216 -> 242 TWh) actually increased.
? 这真的有点颠覆平时的“刻板印象”了。
This really turns the usual \"stereotypes\" on their head.
#能源转型 #可再生能源 #数据分享 #绿色能源 #全球趋势