电力需求:电气化时代全面到来,用电增速首次长期跑赢 GDP
全球整体趋势
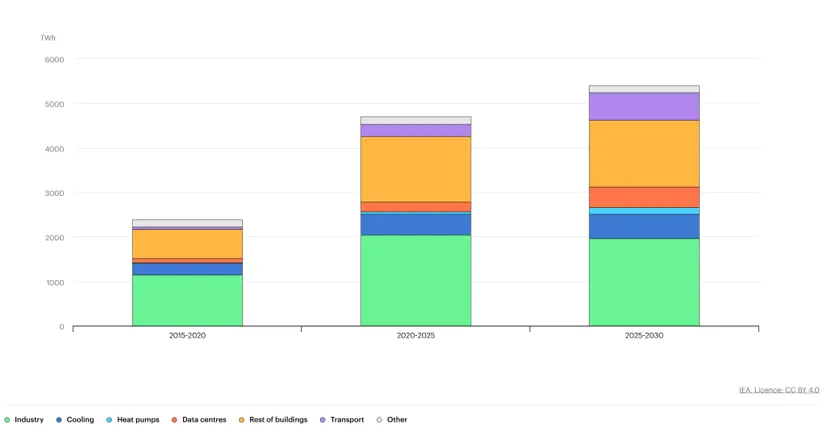
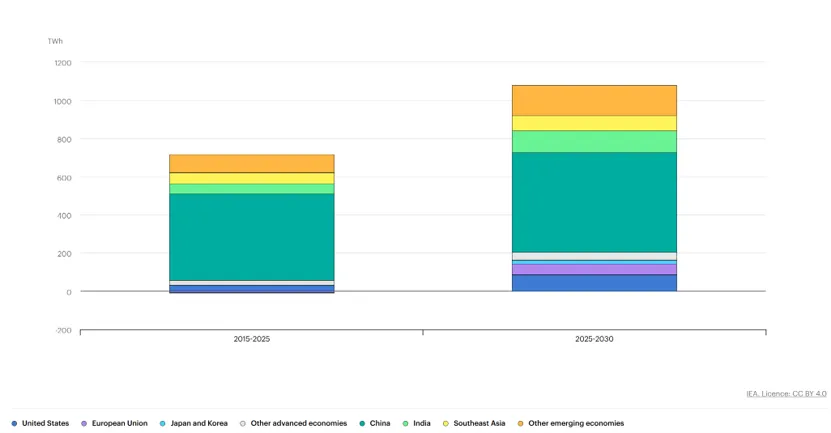
2025 年全球电力需求同比增长 3%,2024 年达 4.4%(热浪与工业拉动);2026-2030 年均增速 3.6%,较过去十年 2.8% 大幅提升,年均新增用电量约 1100 太瓦时(TWh),2030 年全球用电量将达 33600 TWh。三大特征:
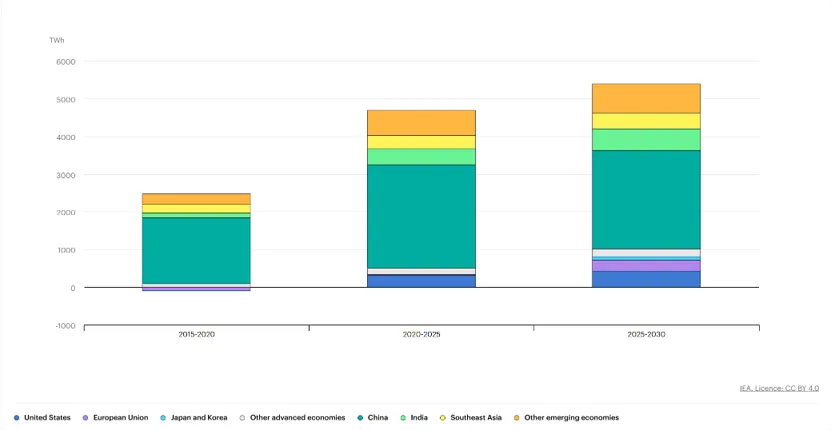
近三十年常态被打破,电力增速长期高于经济增速; 新增用电 80% 来自新兴经济体; 建筑行业是需求最大增量来源(占新增 49%),交通(电动车)需求增速翻倍,工业用电稳步回升。
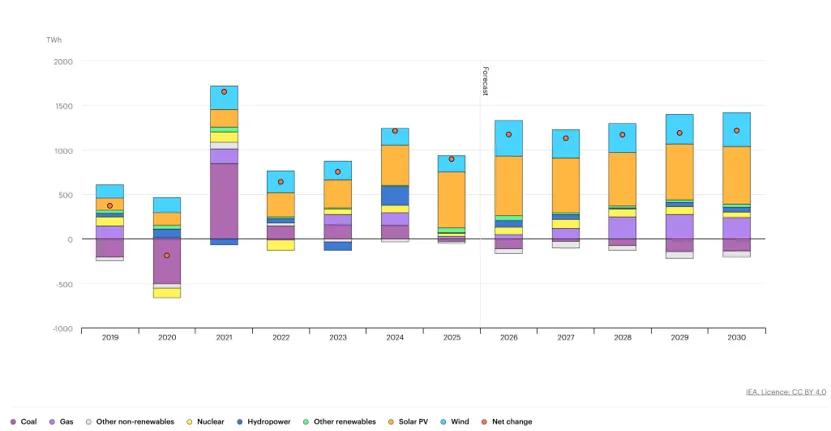
Global electricity total demand growth by sector and end-use, 2015-2030
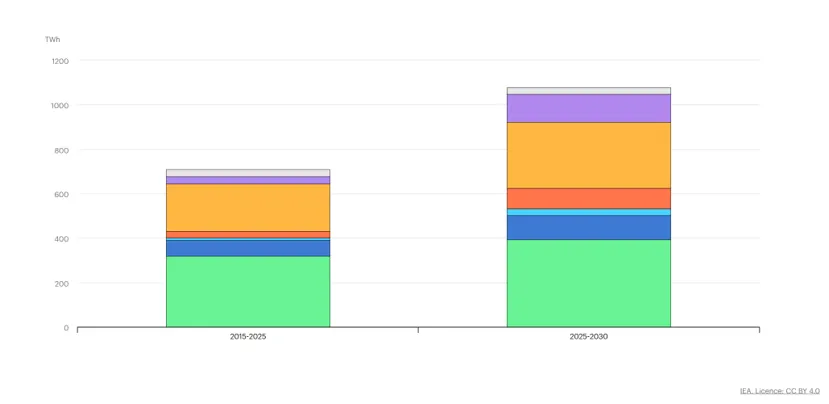
Global electricity average annual demand growth by sector and end-use, 2015-2030

新兴经济体是增长主力
东南亚:2025 年增速回落至 3%,预测期年均 5.3%,印尼、越南贡献主要增量。
发达经济体需求止跌反弹
结束 15 年停滞期,2025 年贡献全球近 20% 用电增长,AI 数据中心、热泵、电动车为核心驱动力:

电力供给:风光核电快速扩张,2030 年低碳电源占全球发电 50%
清洁能源里程碑
2025 年可再生发电量基本追平煤电;2026-2030 年可再生年均新增约 1000 TWh,光伏独揽 600 TWh 增量,年均增速 8%;光伏 2026 年超风电、2029 年超水电。风光 + 核电合计发电量 2030 年占全球 50%。
煤电走势区域分化
全球煤电 2025 年总量持平但区域反差巨大:中、印煤电同比下降,美国因气价上涨煤电反弹,欧盟风光不足限制煤电降幅。2026-2030 全球煤电年均小幅下滑,2030 年煤电占比降至 27%,仍是单一最大发电能源。
天然气发电成关键过渡电源
预测期年均增速 2.6%,美国高用电、中东油气置换是主要增长动力,用于风光出力缺口调峰。

电网:全球大规模并网阻塞,成为能源转型核心瓶颈
严重并网积压
全球超 2500 吉瓦(GW)新能源、储能、数据中心项目卡在电网接入队列;仅新能源待并网 1700 GW、储能 600 GW、数据中心 150 GW。电网建设周期 5-15 年,远短于新能源 1-5 年建设周期,投资缺口显著。当前全球年电网投资 4000 亿美元,2030 年需提升 50% 才能匹配需求。
短期扩容解决方案(无需新建线路)
弃风弃光持续恶化
多国电网拥堵导致技术性消纳量上升:中国 2025 年风光弃置率均超 5%,英国陆上风电弃置 8.5%,智利风光弃置 15%。
标志性事件:2025 年 2 月波罗的海三国电网脱离俄白同步区,接入欧洲大陆电网,实现区域能源独立。
系统灵活性:储能爆发 + 需求响应潜力巨大但未充分利用
用户侧需求响应(DR)潜力闲置
全球仅 100 GW 需求响应资源投入使用;全球空调峰值负荷 600 GW、铝冶炼 160 GW,可调负荷规模巨大但未开发。工业是当前主力(75 GW),建筑仅 30 GW,交通不足 5 GW。欧美、印度、中国出台分时电价、负荷削减政策,挖掘可调资源。
光伏捕获率持续下滑,储能是最优解
大量光伏午间出力叠加低负荷,电价走低、发电收益缩水;德国 25% 光伏发电量出现在负电价时段,澳洲维多利亚、昆士兰超 40%。配套 2 小时以上储能可显著提升光伏电价捕获率。
大型储能装机爆发
2024 年全球新增 63 GW 储能,累计 124 GW;中国为全球最大储能市场,2025 年新增 66 GW/189 GWh。储能核心价值:日内移峰、调频、缓解电网阻塞,长时储能(4h+)成为各国规划主流。但储能同样面临并网排队、多重收费、市场收益不稳定等障碍。
极低净负荷难题
风光大发、负荷低谷时出现 “明亮无风(Hellbrise)” 现象,电网电压、频率失控风险上升,需储能、可调节负荷、跨国互联协同解决。
碳排放:电力排放 2026-2030 年平台期,脱碳加速
2025 年全球电力 CO₂排放持平,结束连续上涨;2026-2030 年维持平稳,电力行业与用电需求深度脱钩。
碳排放强度快速下降:2025 年全球 435 gCO₂/kWh,2030 年降至 360 gCO₂/kWh,年均改善 3.7%;欧盟降幅最强(年均 13%),中国年均 4.8%。
区域分化:中国电力排放小幅逐年下降;印度因煤电扩张,排放持续上涨;美国、欧盟持续减排。
电价与供电安全
电价区域差距悬殊
2025 年欧盟批发电价约 95 美元 / MWh,为美国、印度两倍;工业电价欧盟显著高于中美,削弱制造业竞争力。居民电价自 2019 年涨幅普遍高于收入,税费占居民电费比重高,抑制采暖电气化。负电价在欧洲、澳洲频发,反映系统灵活性不足。
大规模停电风险上升
2025 年全球多起重大停电:伊比利亚半岛大停电、智利全域断电、伦敦希思罗变电站火灾、中东高温电网崩溃;诱因涵盖电压失稳、设备故障、极端天气、基础设施袭击。老龄化电网、极端气候、高比例逆变电源加剧系统脆弱,电压管控成为核心安全议题。
分区域核心特征
亚太:贡献全球 2/3 用电增量,中国主导增长,印度、东南亚煤电仍扩容,风光高速发展;
美洲:美国数据中心拉动用电,光伏、气电双增长,煤电逐步退出;拉美水电基底稳固;
欧洲:可再生 2030 年占发电 63%,核电稳定,煤、气持续压降,电网互联完善;
欧亚:俄罗斯用电萎缩,周边区域小幅增长;
中东:气电快速替代燃油,光伏新增规模可观;
非洲:重点解决电力普及问题,光伏是新增主力,但电网基建滞后。
Power Demand: The Age of Electricity Arrives; Power Growth Outpaces GDP Permanently
Global demand overview
Global electricity demand rose by 3% in 2025 and 4.4% in 2025 driven by heatwaves and industrial activity. The average annual growth rate will hit 3.6% from 2026 to 2030, far exceeding the 2.8% average of the past decade, adding roughly 1,100 TWh of consumption each year, reaching 33,600 TWh globally by 2030.Key features: For the first time in three decades, power demand growth outstrips economic expansion on a sustained basis. Around 80% of incremental electricity consumption comes from emerging economies. Buildings contribute 49% of total demand growth, transport (EVs) doubles its growth share, and industrial consumption rebounds steadily.

Emerging economies as major growth engines
Advanced economies rebound after 15 years of stagnation
Developed markets generated nearly 20% of global demand growth in 2025, fuelled by AI data centres, heat pumps and electric vehicles:

Power Supply: Renewables & Nuclear Surge; 50% of Global Generation by 2030
Clean energy milestones
Renewable generation nearly matched coal output in 2025. Renewables will add around 1,000 TWh annually by 2030 at an 8% yearly growth rate, with solar PV contributing over 600 TWh of the annual increment. Solar will overtake wind in 2026 and hydropower in 2029. Combined renewables and nuclear will make up half of global power generation by 2030.
Divergent coal trends worldwide
Global coal-fired output stayed flat in 2025 with stark regional gaps: coal generation fell in China and India, rose in the US, and declined moderately in the EU. Coal’s generation share will drop to 27% by 2030, yet it remains the single largest power source globally.
Natural gas as a critical transition fuel
Gas generation expands at a 2.6% annual rate to 2030, driven by rising US power demand and oil-to-gas switching across the Middle East, acting as flexible backup for variable renewables.
Power Grids: Congestion Becomes a Critical Transition Bottleneck
Massive interconnection backlog
Over 2,500 GW of renewable, storage and data centre projects are stuck in grid connection queues globally, including 1,700 GW renewables, 600 GW utility batteries and 150 GW large data centre loads. Grid construction takes 5–15 years, much longer than 1–5 years for renewable farms. Annual grid investment needs to rise by 50% from the current $400 billion by 2030 to eliminate the gap.
Near-term capacity unlocking solutions (no new transmission lines required)
Rising renewable curtailment
Grid congestion pushes technical curtailment higher globally: China’s wind and solar curtailment rates exceeded 5% in 2025; 8.5% of UK onshore wind generation was curtailed; Chile’s wind and solar curtailment hit 15%.
Landmark grid event: In February 2025, Estonia, Latvia and Lithuania decoupled from the Russia-Belarus synchronous zone and synchronised with Continental European grids, achieving regional energy independence.
System Flexibility: Energy Storage Booms; Untapped Demand Response Potential
Vast underutilised demand response (DR) resources
Only 100 GW of DR assets are deployed globally. Space cooling (600 GW peak load) and aluminium smelters (160 GW) hold massive flexible load potential. Industry provides 75 GW of available DR, buildings only 30 GW, and transport less than 5 GW. Governments across the EU, India and China roll out time-of-use tariffs and load cut schemes to mobilise flexible consumption.
Falling solar capture rates; storage as a core remedy
Mass midday solar generation coincides with low demand, triggering negative wholesale prices and slashing solar revenue. 25% of solar output in Germany occurs during negative price hours, and over 40% in Australia’s Victoria & Queensland. Pairing solar with 2-hour+ batteries significantly lifts energy capture rates and project economics.
Explosive growth of utility-scale batteries
Global battery additions reached a record 63 GW in 2024, with cumulative installed capacity at 124 GW. China is the world’s largest storage market, adding 66 GW / 189 GWh of new storage in 2025. Batteries deliver intraday arbitrage, frequency regulation and grid congestion relief. Longer-duration storage (4 hours and above) becomes a mainstream development trend, yet projects face interconnection queues, double network charges and volatile revenue streams.
Low net load challenge (“Hellbrise”)
Periods of oversupply from wind and solar under low demand create severe grid stability risks, including voltage fluctuation and frequency deviation. Integrated solutions include battery storage, controllable loads and cross-border power interconnections.
Power Sector Emissions: Plateau from 2026 to 2030, Accelerating Decarbonisation
Global power CO₂ emissions levelled off in 2025 after years of growth, and will remain flat through 2030, showing clear decoupling between electricity demand and carbon output.
Carbon intensity improves rapidly: from 435 gCO₂/kWh in 2025 down to 360 gCO₂/kWh in 2030, with a yearly decline of 3.7%. The EU records the fastest intensity drop (13% annually), while China averages a 4.8% annual reduction.
Regional divergence: China’s power emissions edge down year-on-year; India’s emissions rise alongside coal expansion; US and EU emissions maintain a downward trajectory.
Electricity Prices & Power System Reliability
Widely divergent regional pricing
Average wholesale power price in the EU hit ~$95/MWh in 2025, twice the levels in the US and India. Industrial electricity costs in Europe far outpace those in China and the US, hurting manufacturing competitiveness. Household power bills have risen faster than incomes since 2019, with heavy taxes discouraging heating electrification. Negative prices grow common across Europe and Australia, signalling insufficient system flexibility.
Growing blackout risks
Multiple large-scale outages struck worldwide in 2025: Iberian Peninsula nationwide collapse, nationwide blackout in Chile, Heathrow substation fire, and grid failures driven by extreme heat in the Middle East. Ageing infrastructure, extreme weather and high shares of inverter-based renewables weaken grid stability; voltage control becomes a top operational priority.
Regional Core Trends
Asia Pacific: Supplies two-thirds of global demand growth. China dominates consumption growth; India and Southeast Asia expand coal while scaling up wind and solar rapidly.
Americas: AI data centres drive US demand; solar and natural gas expand, coal phases out gradually. Hydropower remains a foundational resource in Latin America.
Europe: Renewables will cover 63% of power generation by 2030; nuclear stays stable while coal and gas generation shrink continuously, supported by cross-border interconnections.
Eurasia: Russia’s power demand contracts, with modest growth in surrounding regions.
Middle East: Gas power replaces oil generation at high speed, with sizable solar capacity additions.
Africa: Priority lies in universal electricity access; solar is the primary new source, held back by underdeveloped grid infrastructure.