台积电Q1前瞻TSMC Q1 Earnings Preview Report核心观点 / Key Highlights台积电的Q1财报电话会议定于4月16日收盘后举行。我们预计业绩将达到Q1指引的高端,美元销售额环比增长6%,毛利率达64.8%。我们认为管理层可能会重申2026年指引,即美元销售额增长30%,资本支出520-560亿美元。云计算AI需求持续加强,但我们认为供应限制将限制台积电今年实现显著上行的空间。TSMC's Q126 earnings call is scheduled for after market close on 16 April. We anticipate results to reach the higher end of Q1 guidance, with sales up 6% QoQ in USD and GM at 64.8%. We think management is likely to reaffirm 2026 guidance for 30% sales growth in USD and US$52-56bn capex. Cloud AI demand continues to strengthen, but we think supply constraints will limit meaningful upside for TSMC this year.然而,由于内存短缺和内存成本通胀,消费需求正在走弱,可能会限制下半年增长,但如果对台积电有任何影响,应该也是微乎其微的。中东紧张局势增加了宏观不确定性,但考虑到AI对超大规模厂商和企业的重要性,AI支出应能保持隔离,除非冲突旷日持久。Consumer demand, however, is weakening as a result of memory shortage and memory cost inflation, and may cap growth into H226, although the impact on TSMC, if any, should be minimal. Middle East tensions add a layer of macro uncertainty, but AI spend should stay insulated, barring a protracted conflict, given its strategic importance to hyperscalers and corporates.Q2展望 / Q2 Outlook在Q1表现好于季节性之后,我们预测Q2销售额环比增长7%,毛利率稳定在64.8%。目前可见度表明,2026年台积电的N4、N3和N2产能将全面满载。Following a better-than-seasonal Q1, we forecast Q2 sales to grow 7% QoQ with GM stable at 64.8%. Current visibility suggests full utilization across N4, N3 and N2 at TSMC through 2026.大多数新的云计算AI加速器今年正在从N4升级到N3,到今年年底可能贡献台积电N3需求的约60%,而2026年初这一比例不到10%。我们上调了对台积电资本支出的预测,2027年预测为650亿美元,2028年预测为750亿美元(之前2026年预测为560亿美元),这得益于台积电加速N3和N2产能扩张。Most new Cloud AI accelerators are upgrading to N3 from N4 this year, and could contribute ~60% of TSMC's N3 demand by the end of this year, up from <10% in early 2026. We raised our estimates of TSMC's capex to US$65bn in 2027E and US$75bn in 2028E (from US$56bn in 2026E), underpinned by TSMC's accelerating N3 and N2 capacity expansion.我们认为N2的产能提升速度应快于N3量产前三年的速度。我们预测N2装机容量到2026年底达到90kwpm(之前为80kwpm),到2027年底达到140kwpm。We think the N2 ramp should be faster than N3 in its first three years of mass production. We forecast N2 installed capacity to reach 90kwpm (previously 80kwpm) by end-2026 and 140kwpm by end-2027.财报电话会议焦点 / Earnings Call Focus1) 中东冲突:我们认为氦气供应紧张对台积电生产的影响有限。根据我们的分析,电力成本每上涨10%可能会使台积电的毛利率降低0.2-0.3%。1) Middle East conflict: we see limited disruption from tight helium supply on TSMC's production. Every 10% rise in electricity cost could lower TSMC's GM by 0.2-0.3% based on our analysis.2) 整体半导体周期展望,以及智能手机/PC需求疲软可能带来的阻力(如有):瑞银对云计算AI计算需求持乐观态度,预计2026/27年半导体(不含内存)收入将增长25%/17%。瑞银最近将2026年智能手机单位出货量预测下调至下降10%。2) Overall semi cycle outlook, and headwinds, if any, from softening smartphone / PC demand: UBS is positive about Cloud AI compute demand and forecasts semis (ex memory) revenue to grow 25%/17% in 2026/27. UBS recently lowered smartphone unit sell-in to a 10% decline in 2026E.3) AI加速器增长对比2024-29年复合年增长率50%中高位的指引。3) AI accelerator growth vs guidance of mid to high 50% CAGR in 2024-29.4) 台积电解决供应紧张和管理来自英特尔和三星代工厂竞争的资本支出策略。4) TSMC's capex strategy to resolve tight supply and manage competition from Intel and Samsung Foundry.估值 / Valuation我们维持买入评级和2500新台币的目标价。我们的目标价基于21倍2027年预期市盈率,长期盈利复合年增长率为21%。我们预计台积电在2026年将跑赢更广泛的科技供应链,考虑到前沿需求的强劲前景、技术领先地位提升综合定价,以及在旷日持久的冲突中应能保持防御性的合理估值。We reiterate Buy and price target of NT$2,500. Our PT is based on 21x 2027E PE with a 21% long-term earnings CAGR. We anticipate TSMC will outperform the broader tech supply chain in 2026, given the robust outlook for leading-edge demand, strong technology leadership lifting blended pricing, and a reasonable valuation which should keep it defensive amidst a prolonged conflict.关键财务数据 / Key Financial Data
项目
Item
12个月评级
12-month rating
买入
Buy
12个月目标价
12-month price target
新台币2,500元
NT$2,500.00
当前股价(2026年3月27日)
Price (27 Mar 2026)
新台币1,840元
NT$1,840
交易数据
Trading Data
52周范围
52-wk range
新台币2,015-785元
NT$2,015-785.00
市值
Market cap.
新台币47,719十亿/美元1,493十亿
NT$47,719b/US$1,493b
流通股数
Shares o/s
25,934百万股
25,934m (ORD)
自由流通量
Free float
87%
87%
日均成交量(千股)
Avg. daily volume ('000)
41,682
41,682
日均成交额(百万)
Avg. daily value (m)
新台币75,374
NT$75,374
每股盈利(瑞银,摊薄)单位:新台币
EPS (UBS, diluted) (NT$)
2025年预期
12/25E
66.26
66.25
2026年预期
12/26E
90.58
89.85
2027年预期
12/27E
118.77
111.83
台积电平台驱动因素摘要 / TSMC Platform Driver Summary
台积电增长驱动因素
TSMC Growth Drivers
2015
2020
2025
2026E
2027E
15-20复合增长率
20-27E复合增长率
高性能计算-台积电
HPC - TSMC
$5.9B
$14.9B
$70.3B
$102.7B
$141.6B
21%
38%
高性能计算-市场
HPC - Market
$34.4B
$48.8B
$93.9B
$132.0B
$178.5B
7%
20%
台积电增长率
TSMC growth (%)
17%
30%
74%
77%
78%
20%
汽车-台积电
Automotive - TSMC
$1.1B
$1.5B
$6.1B
$6.7B
$7.7B
8%
移动设备-台积电
Mobile - TSMC
$11.6B
$21.9B
$35.8B
$37.7B
$43.2B
14%
物联网-台积电
IoT - TSMC
$1.1B
$3.7B
$6.1B
$6.4B
$7.4B
10%
来自主要客户的收入(单位:百万美元) / Revenue from Top Customers (US$m)
客户
2024
2025
2026E
2027E
占比
苹果
Apple
$19,393
$23,194
$29,704
$35,505
25.3%
英伟达
NVIDIA
$10,865
$22,268
$32,482
$43,993
20.4%
AMD
AMD
$8,336
$11,520
$15,196
$22,944
11.1%
博通
Broadcom
$4,024
$5,281
$13,953
$23,838
11.6%
英特尔
Intel
$7,615
$9,489
$8,486
$7,831
5.3%
高通
Qualcomm
$7,910
$9,448
$9,481
$10,576
6.0%
联发科
MediaTek
$4,370
$5,278
$5,708
$8,521
4.1%
美满电子
Marvell
$1,505
$2,333
$3,184
$4,364
2.0%
N3供需分析 / N3 Supply and Demand Analysis
客户/产品
N3产能需求(千片/月)
Q126E
Q226E
Q326E
Q426E
全年需求(千片)
英伟达
Nvidia
Rubin
Rubin
0
7
15
23
132
Rubin CPX
Rubin CPX
0
0
1
5
18
Vera CPU
Vera CPU
0
1
2
6
28
博通/谷歌/Meta/OpenAI
Broadcom/Google/Meta/OpenAI
谷歌TPU v7/v8AX
Google TPU v7/v8AX
6
11
16
21
161
AMD MI355
AMD MI355
2
2
1
1
18
亚马逊Trainium 3
Amazon Trainium 3
0
2
5
10
51
云计算AI合计需求
Capacity requirement - Cloud AI (kwpm)
9
25
51
99
553
云计算AI占N3需求比例
% of N3 demand
7%
20%
35%
58%
32%
苹果
Apple
iPhone应用处理器
iPhone's apps processor
38
35
31
24
385
Mac处理器
Mac's processor
10
10
10
6
106
iPad Pro & Air的M处理器
iPad's M processor
14
11
12
9
135
高通旗舰手机SoC
Qualcomm flagship smartphone SoC
17
13
9
4
129
联发科旗舰手机SoC
MediaTek flagship smartphone SoC
5
3
3
2
39
消费电子和其他设备合计
Capacity - Consumer and other devices (kwpm)
110
103
96
73
1,149
消费电子占N3需求比例
% of N3 demand
93%
80%
65%
42%
68%
N3总需求
Total N3 demand
119
128
147
172
1,701
台积电N3产能
TSMC's N3 capacity
120
130
150
170
1,710
产能利用率
Capacity utilisation
99%
99%
98%
101%
99%
运营指标 / Operating Metrics
指标
Q125
Q225
Q325
Q425
Q126E
Q226E
Q326E
Q426E
2025
2026E
产能(万片/年,8寸等效)
Capacity (WPO/Y, kpcs 8° eq.)
9,719
10,022
10,326
10,461
10,563
10,731
10,731
10,866
40,528
42,890
出货量(万片/年,8寸等效)
Shipment (WPO/Y, kpcs 8° eq.)
7,333
8,366
9,191
8,912
8,797
8,811
9,619
9,603
33,802
36,831
产能利用率
Utilization rate (%)
75%
83%
89%
85%
83%
82%
90%
88%
83%
86%
平均售价(美元)
ASP (US$)
2,962
3,062
3,132
3,246
3,420
3,654
3,715
3,833
3,108
3,660
总收入(新台币百万)
Total Revenue (NT$m)
839,254
933,792
989,918
1,046,090
1,112,347
1,190,211
1,332,426
1,372,399
3,809,054
5,007,382
资本支出(百万美元)
Capex (US$m)
10,058
9,567
9,608
11,493
14,000
14,000
14,000
14,000
40,739
56,000
毛利率
Gross margin (%)
58.8%
58.6%
59.5%
62.3%
64.8%
64.8%
63.5%
63.1%
59.9%
64.0%
营业利润率
Operating margin (%)
48.5%
49.6%
50.6%
54.0%
55.4%
56.0%
54.8%
54.1%
50.8%
55.0%
瑞银盈利预测 / UBS Earnings Forecasts
新台币百万
(NT$ mn)
2024
Q125
Q225
Q325
Q425
2025
Q126E
Q226E
Q326E
Q426E
2026E
收入
Revenue
2,894,308
839,254
933,792
989,918
1,046,090
3,809,054
1,112,347
1,190,211
1,332,426
1,372,399
5,007,382
同比变化
- YoY chg (%)
34%
42%
39%
30%
20%
32%
33%
27%
35%
31%
31%
环比变化
- QoQ chg (%)
-
-3%
11%
6%
6%
-
6%
7%
12%
3%
-
美元收入(百万)
Revenue (US$ mn)
90,184
25,526
30,070
33,097
33,731
122,031
35,201
37,665
42,165
43,430
158,461
毛利润
Gross profit
1,624,354
493,395
547,369
588,543
651,987
2,281,294
720,317
771,067
845,816
865,782
3,202,982
毛利率
- Gross margin
56.1%
58.8%
58.6%
59.5%
62.3%
59.9%
64.8%
64.8%
63.5%
63.1%
64.0%
营业利润
Operating profit
1,322,053
407,081
463,424
500,685
564,903
1,936,092
615,834
666,170
730,769
742,238
2,755,011
营业利润率
- OP margin
45.7%
48.5%
49.6%
50.6%
54.0%
50.8%
55.4%
56.0%
54.8%
54.1%
55.0%
税前利润
Pre-tax profit
1,405,839
430,895
493,035
525,369
592,363
2,041,663
634,781
684,447
749,768
762,701
2,831,697
净利润
Net profit
1,173,268
361,564
398,273
452,301
505,744
1,717,883
530,370
554,730
626,384
637,184
2,348,668
报告每股收益(新台币)
Reported EPS (NT$)
45.25
13.95
15.36
17.44
19.50
66.26
20.45
21.39
24.16
24.57
90.58
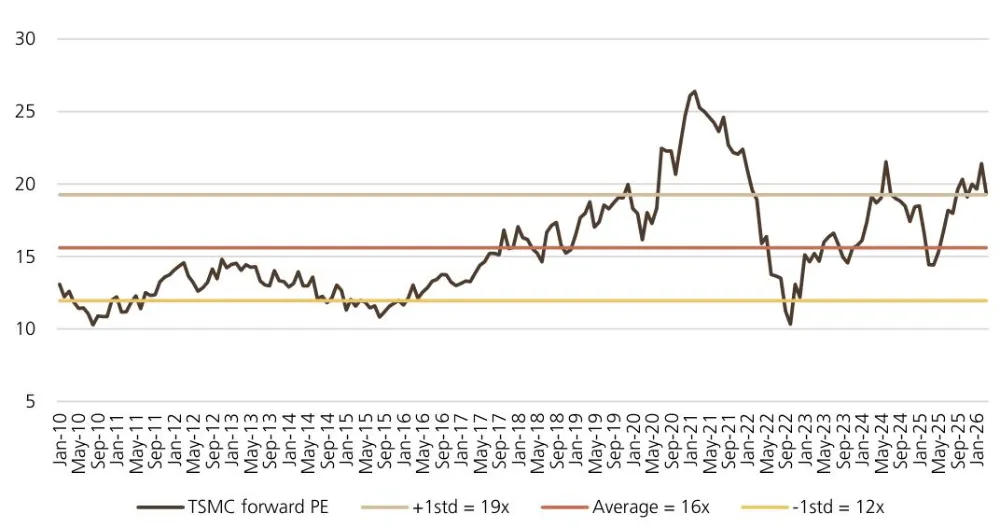
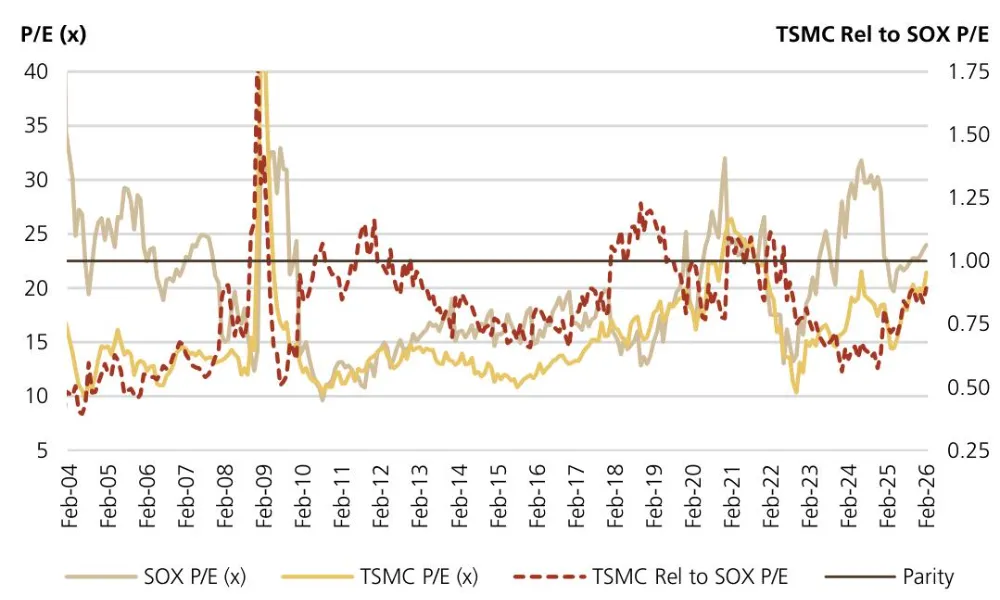
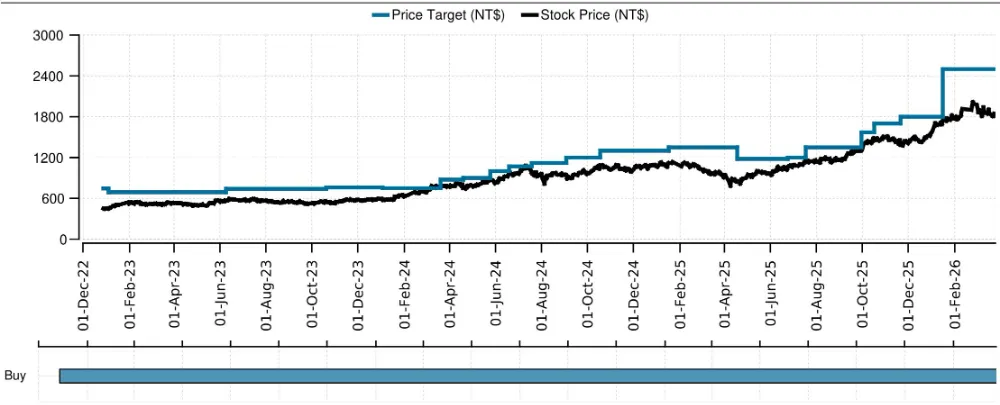
估值图表 / Valuation Charts图7:台积电12个月前瞻市盈率bandFigure 7: TSMC's 12-month forward PE band图8:台积电相对SOX估值仍有折让Figure 8: TSMC's valuation still at a discount to SOX图9:台积电股价走势图Figure 9: Taiwan Semiconductor Manufacturing Stock Price Trend估值方法与风险声明 / Valuation Method and Risk Statement我们基于市盈率倍数对台积电设定目标价。We base our price target for TSMC on a PE multiple.我们认为台积电面临各种风险,包括技术快速变化、激烈竞争、高资本投资和周期性需求。台积电还有向员工支付股票期权的历史,这可能会稀释每股收益。We think TSMC faces a variety of risks, including rapidly changing technology, intense competition, high capital investment and cyclical demand. TSMC also has a history of paying stock options to its employees, which could dilute earnings.预测回报 / Forecast Returns