第三阶段(持续过程验证)是验证生命周期中最长的阶段。该阶段旨在证明过程持续在验证条件下运行,核心目标是识别 “漂移” 与 “偏移”。许多公司会采用统计过程控制(SPC)实现这一目的。ECA就该主题开展了一项调查,其中ECA 希望了解 统计过程控制(SPC) 是否还应用于其他领域、使用何种控制图、过程能力指数的限值要求等问题。
并非所有参与者都回答了每个问题:部分参与者会提供多个答案,且四舍五入处理也导致答案总和并非总能达到 100%。
原文及其翻译:
Biographical Data
背景信息
Most participants came from companies with more than 500 employees (44%), 38% of participants work in companies with 101-500 employees, 12% come from companies with 51-100 employees, and 14% from companies with 1-50 employees.
大多数参与者(44%)来自员工人数超 500 人的企业,38% 来自员工 101-500 人的企业,12% 来自员工 51-100 人的企业,14% 来自员工 1-50 人的企业。
The majority of participants (74%) manufacture pharmaceuticals. Chemical active ingredient manufacturers accounted for 32% and manufacturers of biological pharmaceuticals for 21%. Manufacturers of medical devices also accounted for 18%, and 3% came from excipient manufacturers.
绝大多数参与者(74%)从事制药生产相关工作:化学原料药生产商占 32%,生物制药生产商占 21%,医疗器械生产商占 18%,辅料生产商占 3%。(注:各类别占比总和超 100%,因部分参与者可能涉及多个领域)
Survey Results - Part I
调查结果 - 第一部分
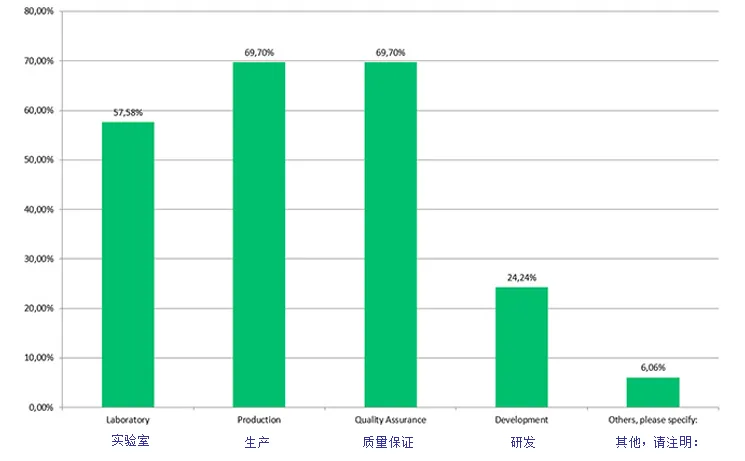
Area of Application of SPC: The question of which areas SPC is used in was particularly interesting? (Multiple answers were possible). Here, 70% of respondents indicated the production area and the quality assurance area respectively. 58% specified the laboratory area, followed by the development area with a slight gap (24%).
统计过程控制(SPC)的应用领域:关于 SPC 应用于哪些领域的问题尤为值得关注?(可多选)。其中,70% 的受访者分别选择了生产领域和质量保证领域,58% 选择了实验室领域,紧随其后的是研发领域(24%),二者存在一定差距。
In which areas do you already use SPC?(please select all that apply)
您已在哪些领域使用统计过程控制(SPC)?(请选择所有适用的选项)
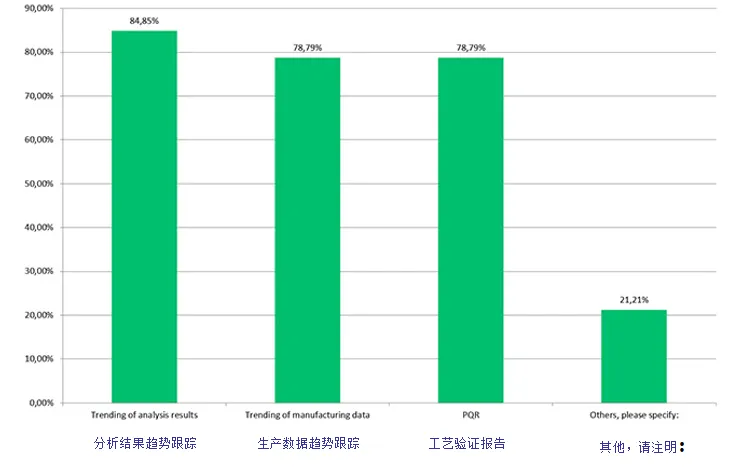
And for what purposes is SPC used?
统计过程控制(SPC)用于哪些目的?
Multiple answers were also possible for this question. The responses included:
该问题同样可多选,受访者提到的用途如下:
Trending of analysis results: 85%
分析结果趋势跟踪:85%
Trending of production data: 79%
生产数据趋势跟踪:79%
PQR (Process Qualification Report):
79%工艺验证报告(PQR):79%
More than 20% of the responses related to "Other".
超过 20% 的回答属于 “其他” 类别。
The "Other" responses included: Complaints, Suitability of specifications/validation, "Continuous Process Verification", Stability testing, Deviation investigations, Continued process validation.
“其他” 类别下的具体用途包括:投诉处理、规格 / 验证适用性评估、持续过程验证、稳定性测试、偏差调查、延续性工艺验证。
For which purposes do you use SPC?(please select all that apply)
您使用统计过程控制(SPC)的目的是什么?(请选择所有适用的选项)
Survey results Part II
调查结果 第二部分
Which control charts are used? Here, too, multiple answers were possible.
使用哪些控制图?该问题同样支持多选。
The use of X/S charts (50%) and I/MR charts (49%) were mentioned almost equally. Control charts for attributive characteristics are also used at a comparably high rate (47%). Levey-Jennings charts (13%) and Cusum charts (9%) are also used.
X/S 图(50%)和 I/MR 图(49%)的使用占比几乎持平;属性特征控制图的使用率也较高(47%);同时也会使用 Levey-Jennings 图(13%)和累积和图(Cusum 图,9%)。
Surprisingly, many participants have no problems with SPC (90%). Consequently, only 10% have problems with SPC. Biological products and attributive data were mentioned as problem areas.
令人意外的是,多数参与者在使用 SPC 时没有遇到问题(90%),仅有 10% 的参与者存在使用难题,其中生物制品和属性数据被列为问题领域。
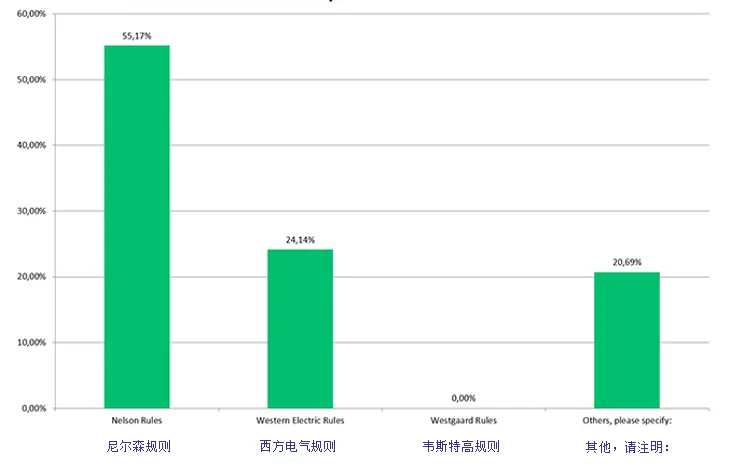
The answers to the question of which statistical methods are used were also interesting. With 55%, the Nelson rules were in first place, followed by the Western Electric rules (24%). None of the participants use the Westgaard rules. At 21%, the “Other” category is also relatively well represented. The following were mentioned here: control limits vs. specification limits, use of default rules in the Minitab statistics tool, a combination of different rules, Deming rules.
关于使用何种统计方法的回答也很有意思:尼尔森规则以 55% 的占比位居第一,其次是西方电气规则(24%);没有参与者使用韦斯特高规则;“其他” 类别占比也达到 21%,具体包括:控制限与规格限的对比、Minitab 统计工具中默认规则的使用、不同规则的组合、戴明规则。
Which statistical methods do you use to evaluate the control charts?
您使用哪些统计方法来评估控制图?
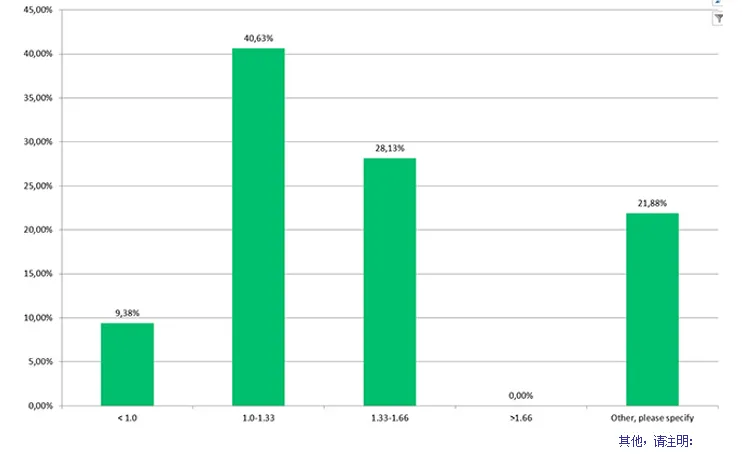
And what about the use of process capability indices?
那么过程能力指数的使用情况如何?
85% of participants use them. Most of them (41%) have a limit between 1.0 and 1.33, while 28% go even further and have chosen a limit of 1.33–1.66. On the other hand, 9% also accept values of 1.0. Comments on “Other” (22%) were: >1.33, depends on the amount of data, not used in PQR or production, >= 1.0.
85% 的参与者会使用过程能力指数。其中 41% 的人将限值设定在 1.0 至 1.33 之间,28% 的人要求更高,选择了 1.33 至 1.66 的限值;另有 9% 的参与者接受 1.0 的数值。“其他” 选项(22%)的备注包括:>1.33、取决于数据量、不用于工艺验证报告(PQR)或生产、≥1.0。
What is your threshold value when using process capability indices?
您在使用过程能力指数时的阈值是多少?
And what software is used for SPC?
统计过程控制(SPC)使用何种软件?
Minitab is clearly in first place with 44%. Statgraphics and the internal LIMS system are also mentioned, each with 6%. The “Other” response is surprisingly high (41%). Excel is mentioned as a tool seven times, which is strikingly frequent.
Minitab 以 44% 的占比稳居首位;Statgraphics(统计图形软件)和内部实验室信息管理系统(LIMS)各占 6%;“其他” 选项占比意外之高(41%),其中 Excel 被 7 次提及,使用频率尤为突出。
Conclusion: SPC is widely used in the pharmaceutical industry without any major problems. Different control charts are used, and the limits for process capability indices are also chosen differently.
结论:统计过程控制(SPC)在制药行业应用广泛且无重大使用难题,企业会采用多种控制图,过程能力指数的限值设定也各不相同。